Survey results highlight wins for transit

RideKC uses a variety of statistics to track our performance: from ridership to bus maintenance statistics to customer service phone calls.
Last year, we conducted two major surveys to get a broader look at our performance. The first was a survey of our current riders, the second was a survey of the greater community, which focused on people who do not ride. We gained valuable insights from both.
Rider Survey
For the rider survey, we heard from more than 3,500 passengers on MAX, local and express RideKC routes. We asked how satisfied customers were with key aspects of service, such as buses staying on schedule and driver safety. We also wanted to know where riders get information about bus service and to see if there were any changes in rider demographics since our last rider survey.
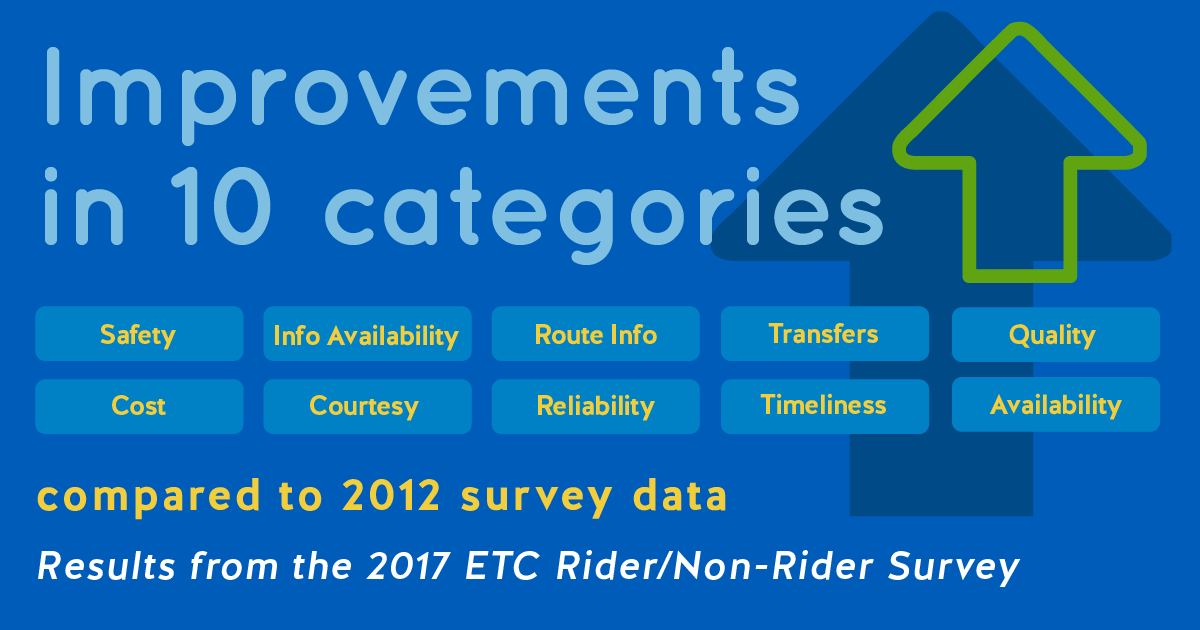
Customer Satisfaction: Rider satisfaction improved in 10 out of 11 categories: safety, information availability, route information, transfers, quality, cost, courtesy, reliability, timeliness and availability of service. The areas where customers rated RideKC Bus and MAX service highest were driver safety, ease of understanding route information, and cost. Driver safety was rated “excellent or very good” by 77 percent of MAX riders and 71 percent of local bus riders. Areas that ranked lowest included the cleanliness of vehicles and stations, buses staying on schedule, and service availability for local bus service.
KCATA has been taking steps to keep buses on schedule. Many buses now travel more direct routes through downtown, instead of weaving through downtown. Last October, Main MAX moved to Grand Blvd., resulting in a major schedule improvement. We have also balanced bus stops on many routes, removing stops that were too close together. One big change impacting cleanliness that is getting great customer response is the change to vinyl seats: They are easier to keep clean and it’s easier for customers to see that they are clean.

Who is riding: Our survey showed that people on board RideKC were typically either employed or going to school. Seventy-six percent of local riders were employed or college students, and 80 percent of MAX riders had a job or were going to school. Many riders have completed two or more years of college: 41 percent of local bus riders and 51 percent of MAX riders. Over 70 percent of riders use the service 5 or more days a week. About 30 percent of riders have been using RideKC for less than two years and just less than half have been customers for six or more years. The top three ways that people pay are cash fare, 3-Day pass and 1-Day pass.
Community Survey Results
For our community survey, we polled 1,500 people who haven’t ridden RideKC buses in the last year to gauge their opinions and awareness of transit in the KC area. We also wanted to see if people recognized the new RideKC brand and gauge awareness of our services. We heard a positive message here, as well. The results show that the region understands the importance of transit to the local economy. People are also recognizing the new RideKC brand.
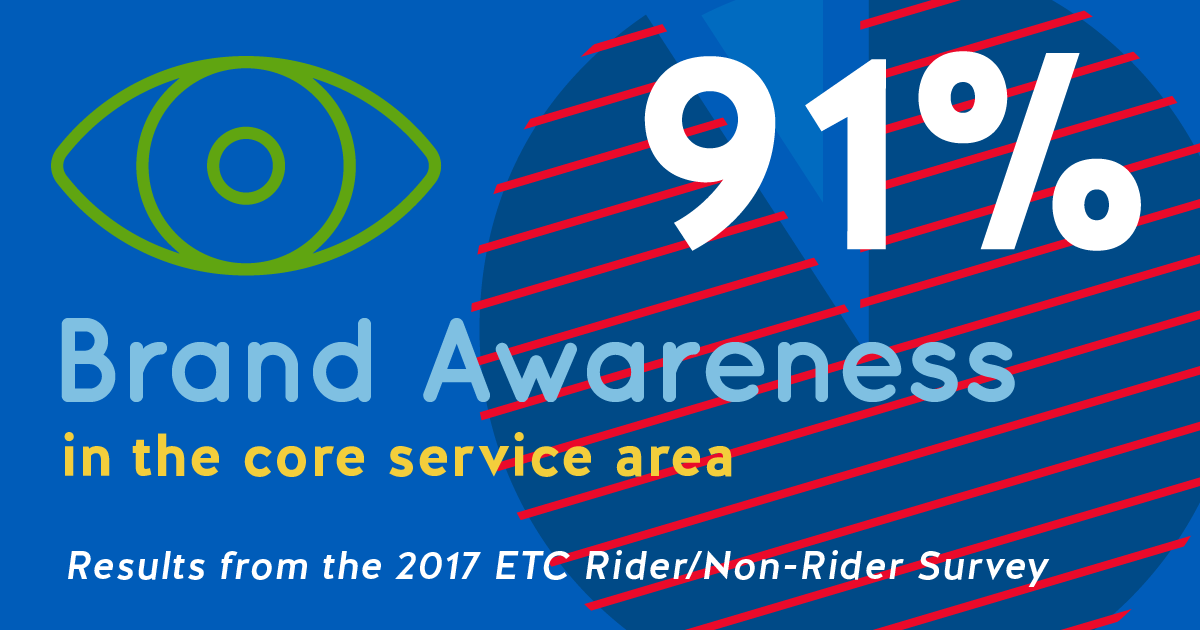
A clear majority recognize the importance of funding public transportation: 91% of people in the core service area and 85% outside of the core service area thought it was “somewhat or very important” to fund public transportation. When asked about transportation priorities for the region, such as widening roads or building new roads, people ranked public transportation as the region’s top transportation priority.
A strong majority of people said they recognized RideKC as the new regional brand for public transportation. A few years ago, the region came together to unify transit under one brand with more coordinated management for public transportation. The Metro, The JO and The Bus are disappearing from buses, signs, and schedules, and RideKC has taken hold and recognized as the public transportation provider for our region. More than 80 percent of people recognized RideKC as the name of public transit. Recognition is over 90 percent where our service is concentrated in the City of Kansas City, Missouri.
RideKC thanks our riders and community members who took the time to answer the survey questions. The information provided in these surveys helps us better serve our community.
