Report: Who is Riding Public Transportation?

Nearly 90% of Public Transit Trips Impact Economy Through Work Commute and Consumer Spending
Work. Shopping. Recreation. School. Across the nation, these are the top reasons people hop on buses, streetcars and trains.
Public transit riders are part of the engine that powers America’s economy, as shown in a new study. The American Public Transportation Association’s study "Who Rides Public Transportation" shows that 87% of public transit trips on bus and rail directly impact the economy.
“The data is clear: Public transit riders’ impact on the economy has grown tremendously over the last 10 years,” said APTA Acting President and CEO Richard White. “In addition to the work commute, Americans are taking transit to shop, dine and attend entertainment venues more than ever before. As the new Congress and Administration look to boost the economy, investing in America’s public transportation infrastructure should be a key element of that plan.”
The report combines 700,000 passenger surveys from across the nation and is the most extensive report of American public transit riders.
Facts and Demographics
Trip Purpose: Trips to work account for nearly half of all transit rides nationally, and more than one in five trips are for shopping or dining. About 63% of riders use transit at least 5 days a week; 13% ride 7 days a week. (See chart below.)

Employment and student status: 71% are employed, while 7% are students. More than three-fourths of transit riders (78%) are either currently employed or preparing for employment.
Education and income: More than 51% of public transit riders hold a bachelor’s degree or higher level of education. Public transit is a lifeline to many Americans. Thirteen percent of U.S. households have incomes of less than $15,000, but among transit-using households, the comparable figure is 21%. Forty-six percent of transit-using households have incomes of more than $50,000.
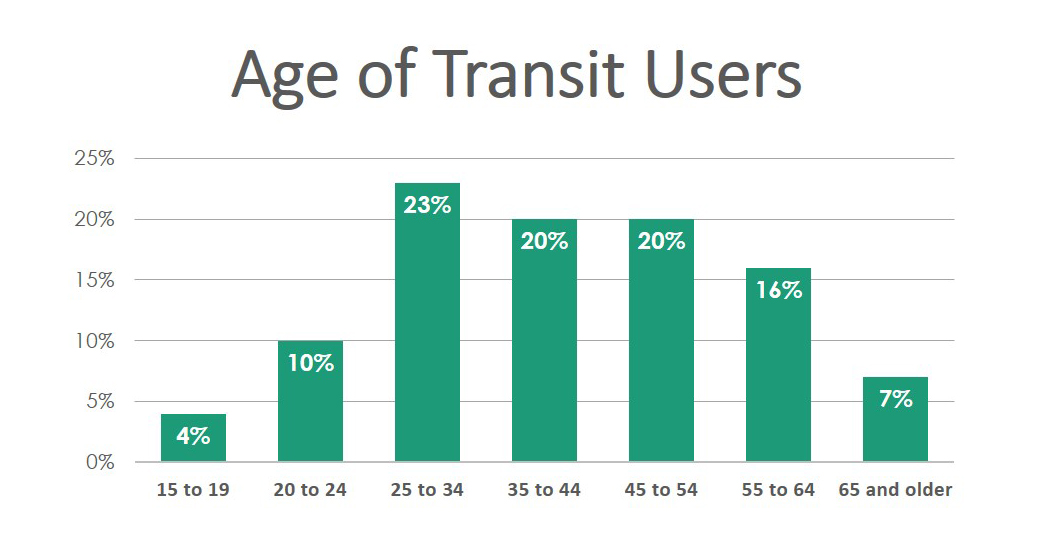
Age and Gender: The majority of public transit users, 55%, are women. Transit riders are more likely than the general population to fall into the age range from 25 to 54. They are less likely than the general population to be 65 or older. People 65 and older represent 17% of the population but only 7% of transit riders. (See chart below.)

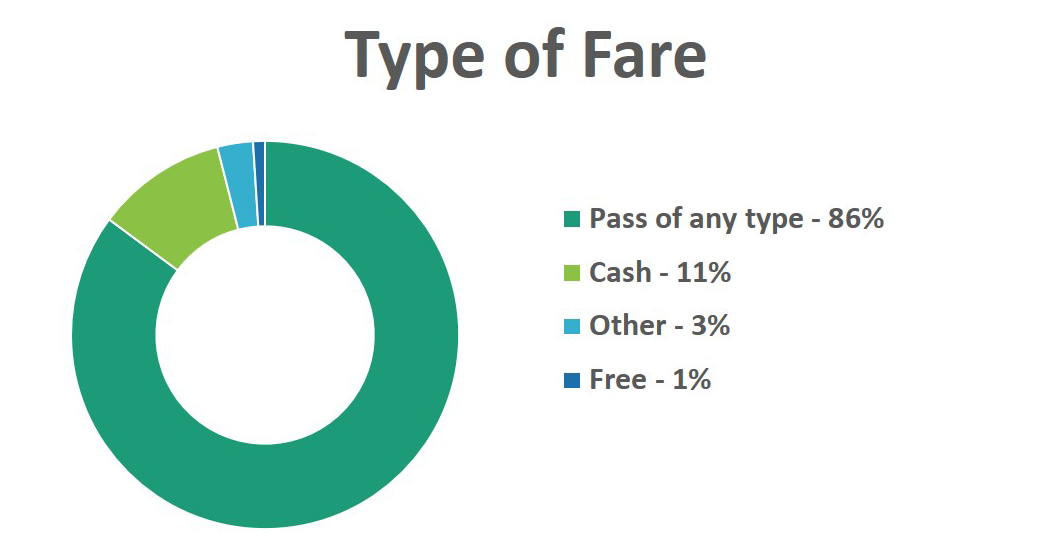
Fares: How do most people pay for their ride? Passes are the most popular way to pay, by far. Cash fares account for only 11%. (See chart below.)

RideKC conducted an on-board customer satisfaction survey in March, which will track similar information about transit use and demographics locally.
About the Who Rides Public Transportation study: The study is based on a total of 695,748 respondent questionnaires, from surveys conducted between 2008 and 2015. To read the study in its entirety go to www.apta.com/WhoRides.
